Here we consider the functional form of the scattering from mass and surface fractals.
The mass of a fractal object of dimension d scales as M(r) ~ rd. For a surface fractal, the surface area scales as S(r) ~ r2-ds where ds is between 2 and 3 for a surface fractal in three-dimensional space. It is equal to 2 for a perfectly smooth surface, and approaches 3 for a highly folded/convoluted surface.
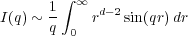
Scattering from a mass fractal is considered from the 3D Fourier transform of the scattering length distribution function, which now scales as
This yield a scaling of

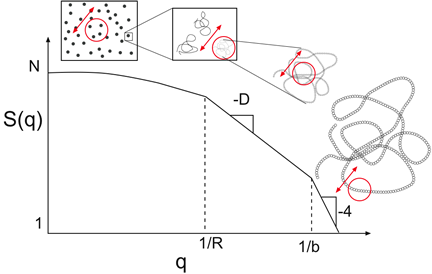
The slope of a log-log plot of intensity vs wave vector thus yields the fractal dimension of the object under study at a particular length scale. At very high q, we get a scaling of q-4 which is characteristic of sharp interfaces, as described by Porod’s law [1].
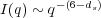
The scattered intensity due to surface fractal scattering scales as
If we examine the scattering of a polymer chain across a wide q-range, we can see that at very low q, as discussed prior, we are in a regime where we are probing correlations between polymer chains. In a dilute solution, there are no correlations and so the scattered intensity is constant, independent of q and proportional to the concentration of the system. At higher q, we start to probe scattering due to correlations of monomers on a single polymer chain, yielding information about the radius of gyration. At slightly higher q, > 1∕Rg, we become sensitive to the fractal nature of the polymer and the intensity here scales as q-d where the fractal dimension is related to the polymer scaling exponent ν in R ~ bNν encountered earlier. For ideal (Gaussian) chains, ν = 1∕2 and so d = 2, the Debye result. At very high q, we start to probe scattering from individual monomers, which, since they are presumed to have sharp smooth interfaces, produce the Porod scaling of q-4. Figure 4 schematically illustrates the transition among length scales in typical SAXS data [3].
|
|